IELTS Task 1 - Vertical Bar Graph: Oil Production by Gulf Countries
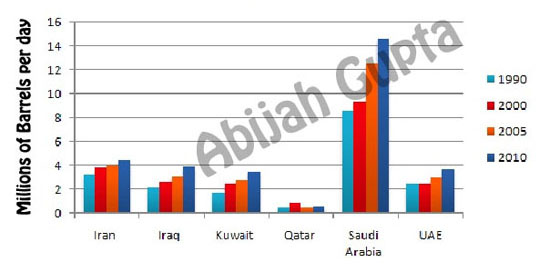
The given graph shows the oil production for 6 Gulf countries from 1990 to 2010.
Write a report for a university lecturer making comparisons where relevant and report the main features.

The vertical bar graph depicts the oil production in millions of barrels per day for six Gulf countries.
From an overall perspective, it is noticeable that almost all countries' oil production had increased from 1990 to 2010. Saudi Arabia noticed the most significant rise where the production increased from 8.2 in 1990 to 14.2 in 2010. Out of all the six countries, Saudi Arabia's output remained the highest. Iran was in the second position in terms of oil production. Its oil production in 2010 was 4.2 while the figure was 1.5 less in 1990.
Iraq and UAE have similar profiles, and their production figures have been similar over the four years. Iraq and UAE's production in 2010 was approximately 2.7.
Qatar remained the lowest producer of oil with an average production of 0.2, with an exception in 2000 where the production was 0.4
In a nutshell, it is crystal clear that Saudi Arabia has always been the maximum producer of oil while Qatar has been the lowest.
Click here to go to the main IELTS Writing Menu


