IELTS Task 1 - Vertical Bar Chart: Internet usage by age
The given graphs show the internet usage by age.
Write a report for a university lecturer making comparisons where relevant and report the main features.

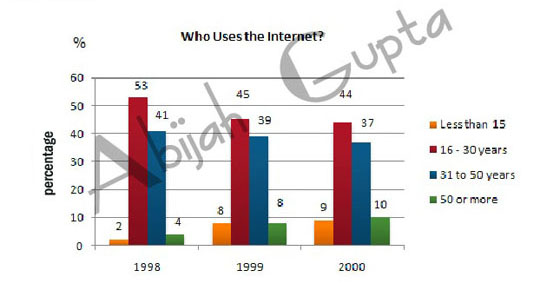
The vertical bar graph depicts the changes in the age profile of Internet users between 1998 and 2000. The data is reported in percentage.
Overall, the primary users of the Internet were young adults between 16 and 30 years old. In 1998, they accounted for more than half of all users. Even though usage dropped by 9% within two years, they continued to be the most prominent group.
The second biggest group of Internet users aged between 31 and 50 reported a 41% usage in 1998, falling slightly to 37% in 2000. When combined with the 16-30 age group, over 94% of users in 1998 were between 16 and 50. In 1999, the number of children online quadrupled from 2% to 8%, and it continued to increase in 2000. There were similar increases for older users, rising from 4% in 1998 to 10% in 2000.
Overall, users between the ages of 16 and 50 accounted for most Internet users.
Click here to go to the main IELTS Writing Menu


