IELTS Task 1 - Horizontal Bar Graph: Freedonia employment by sex
The given graph shows the employment rate for Freedonia by sex in 1975 and 1995.
Write a report for a university lecturer making comparisons where relevant and report the main features.

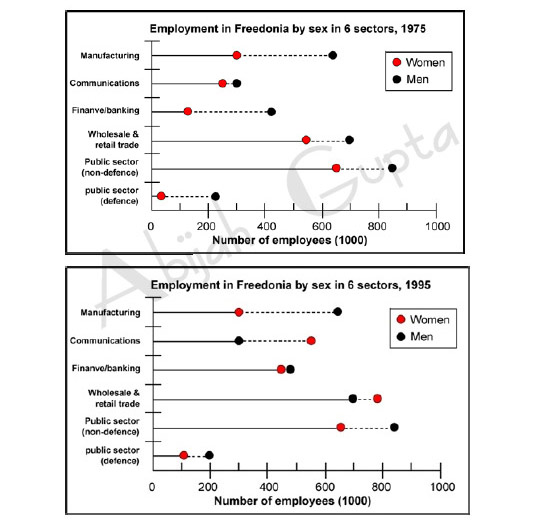
The two horizontal bar graphs reveal the employment statistics for Freedonia by sex in six different sectors for the years 1975 and 1995. The data is calibrated in thousands.
At first glance, it is evident that 1975 to 1995 brought significant changes in the representation of women in Freedonia's workforce. In 1975, around 3 million men and 2.5 million women worked in the communications sector. Twenty years later, though the number of men remained unchanged, women rose to 5.5 million.
The wholesale & retail trade and the communications sector saw women's employment surpass men by 1995. Women figures also nearly caught up in finance/banking while doubling in the defence public sectors. The number of men grew only marginally from 425,000 to 480,000 over the same period.
Two sectors that retained stable employment numbers for both men and women were manufacturing, which had about 3 million women and 6 million men in both surveyed years.
Overall, women's employment rose significantly in the two decades.
Click here to go to the main IELTS Writing Menu


