IELTS Task 1 - Vertical Bar Graph: Favourite pastime activities
The given graph shows the favourite pastime activities for young children.
Write a report for a university lecturer making comparisons where relevant and report the main features.

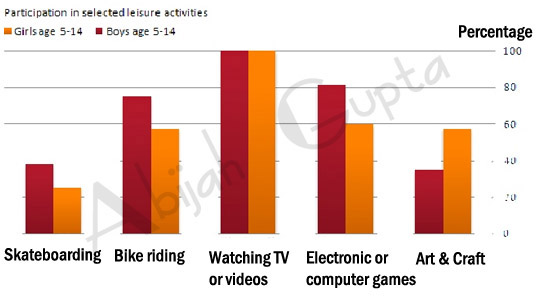
The vertical bar graph reveals the preferred leisure activities of children aged 5-14. The data is calibrated in percentage.
Out of the children surveyed, it is apparent that watching TV or videos was the most preferred leisure activity. In addition to it, the second most popular activity, preferred by 80% of boys and 60% of girls, was playing electronic or computer games.
Girls rated activities such as art and craft at approximately 60%; however, only 35% of boys opted for creative pastimes. On the other hand, bike riding was almost as popular as electronic games amongst boys and nearly 60% of girls.
Only 25% of the girls voted for Skateboarding as their favourite pastime, making it the least popular amongst girls; however, it attracted the same amount as Art & Craft for boys.
Overall, watching TV or videos was the preferred pastime for both boys and girls.
Click here to go to the main IELTS Writing Menu


